Audiovisual cartography examples
This page presents selected examples of audiovisual maps created by Glenn Brauen between approximately 2004 and 2012 and links to videos showing each in use. See About for more information and a brief explanation of why these are presented here as videos.
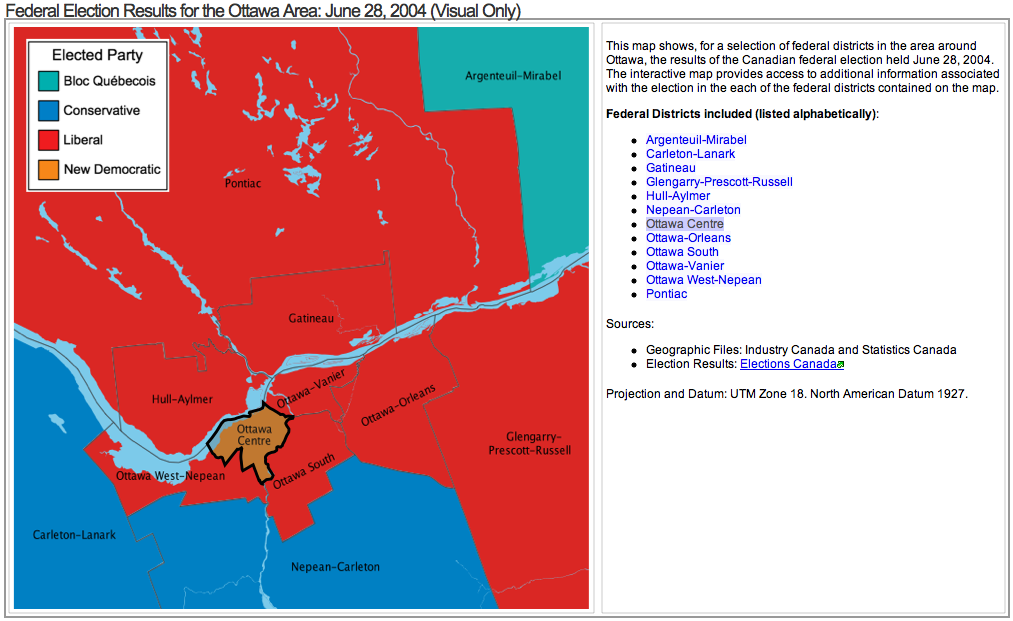
Canadian federal election results, Ottawa area districts, 2004.
This example is described in the following paper:
-
Brauen, G. (2006) “Designing interactive sounds maps: Using scalable vector graphics.” Cartographica 41:1, 59–71.

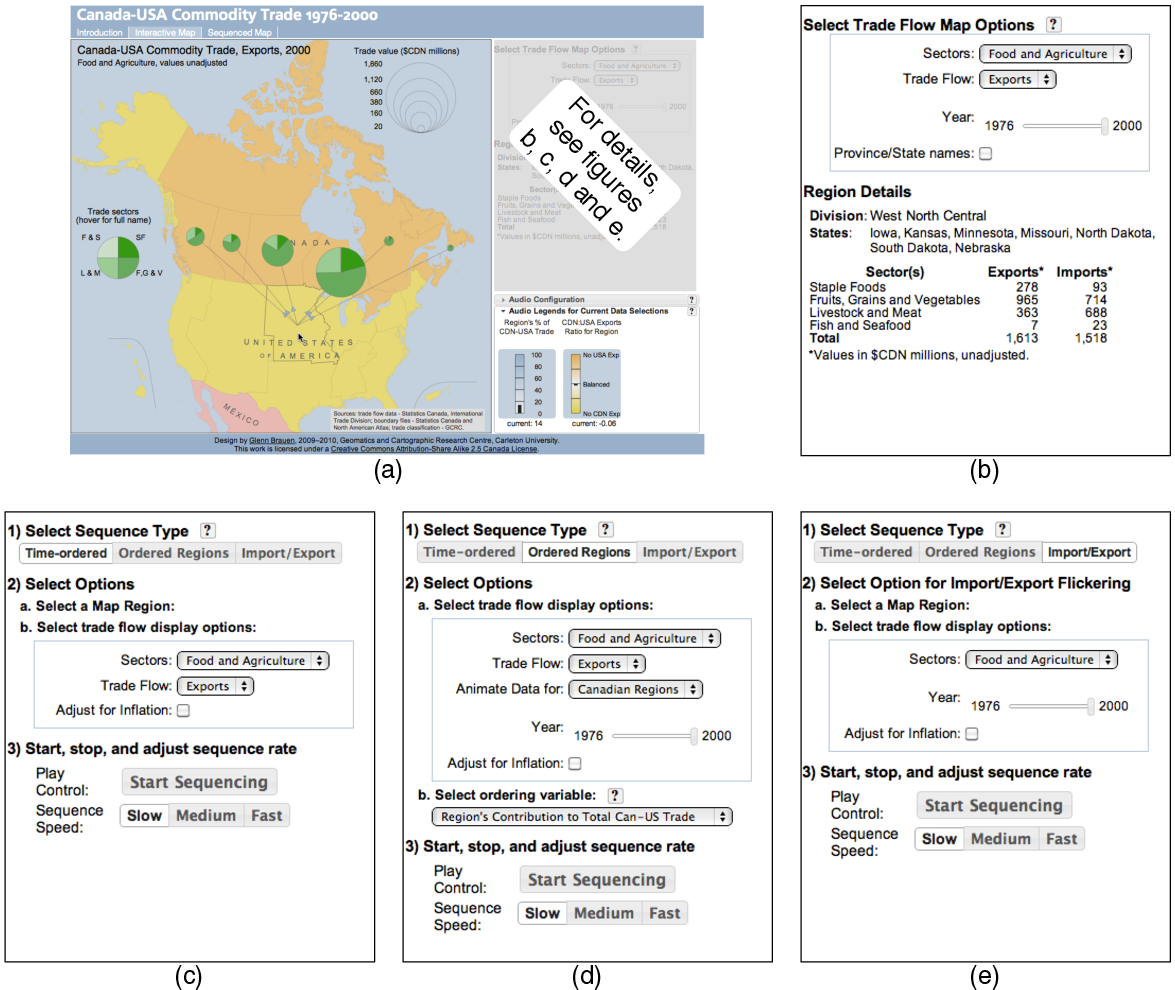
Canada-USA Commodity Trade 1976-2000
Described in my dissertation:
-
Brauen, H. G. (2011) “Toward interactive audiovisual cartography: Motivations, design strategies, and methods.” Unpublished PhD dissertation, Carleton University, Ottawa, Canada.

Video links:
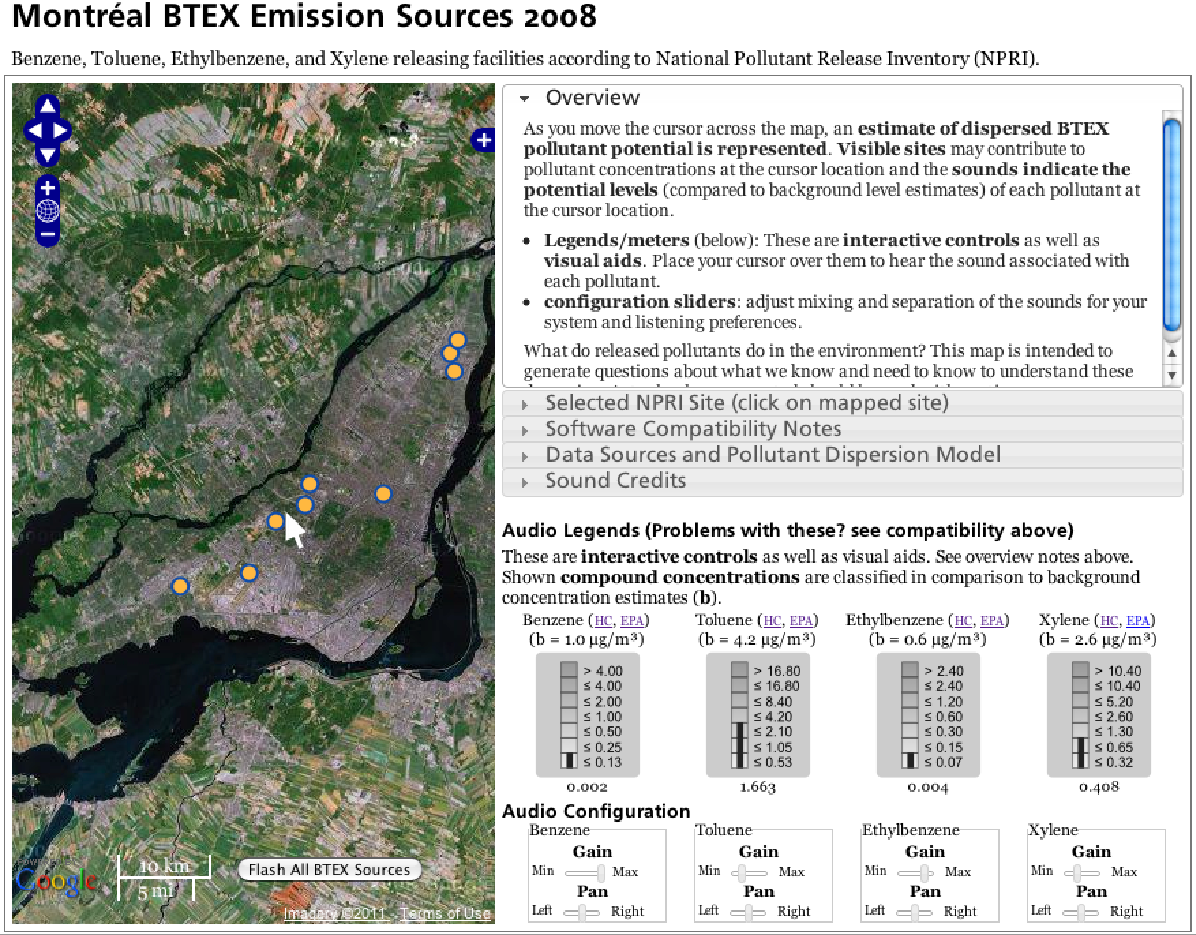
Montreal BTEX Emission Sources 2008
This example was created for an International Cartographic Association (ICA) Arts and Cartography workshop and is discussed in these book chapters:
-
Brauen, G. (2011) “Interactive audiovisual mapping: BTEX emissions from NPRI reporting facilities in Montreal.” In Mapping Environmental Issues in the City. Lecture Notes in Geoinformation and Cartography. ed. S. Caquard, L. Vaughan and W. Cartwright, 74-108. Berlin: Springer.
-
Brauen, G. (2014) “Interactive Audiovisual Design for Cartography: Survey, Prospects, and Example.” In Developments in the Theory and Practice of Cybercartography: Applications in Indigenous Mapping, ed. D.R.F. Taylor and T.P. Lauriault, 141-159. Elsevier.
